Fundamentals of Hypothesis Testing
Let’s see an example of a person is on trial for a criminal offense and the judge needs to provide a verdict on his case. Now, there are four possible combinations in such a case:
- First Case: The person is innocent and the judge identifies the person as innocent
- Second Case: The person is innocent and the judge identifies the person as guilty
- Third Case: The person is guilty and the judge identifies the person as innocent
- Fourth Case: The person is guilty and the judge identifies the person as guilty
Null Hypothesis and Alternate Hypothesis
We consider the Null Hypothesis to be true until we find strong evidence against it. Then. we accept the Alternate Hypothesis. We also determine the Significance Level (⍺) which can be understood as the Probability of (Judge Decided Guilty | Person is Innocent) in the previous example. Thus, if ⍺ is smaller, it will require more evidence to reject the Null Hypothesis. Don’t worry, we’ll cover all of this using a case study later.
Steps to Perform Hypothesis Testing
There are four steps to perform Hypothesis Testing:
- Set the Hypothesis
- Set the Significance Level, Criteria for a decision
- Compute the test statistics
- Make a decision
Steps 1 to 3 are quite self-explanatory but on what basis can we make a decision in step 4? What does this p-value indicate?
We can understand this p-value as the measurement of the Defense Attorney’s argument. If the p-value is less than ⍺ , we reject the Null Hypothesis or if the p-value is greater than ⍺, we fail to reject the Null Hypothesis.
P-value is a numerical value between 0 and 1, the more it closes to 1, the more the predicted model is similar to the null hypothesis.
Critical Value and P-value
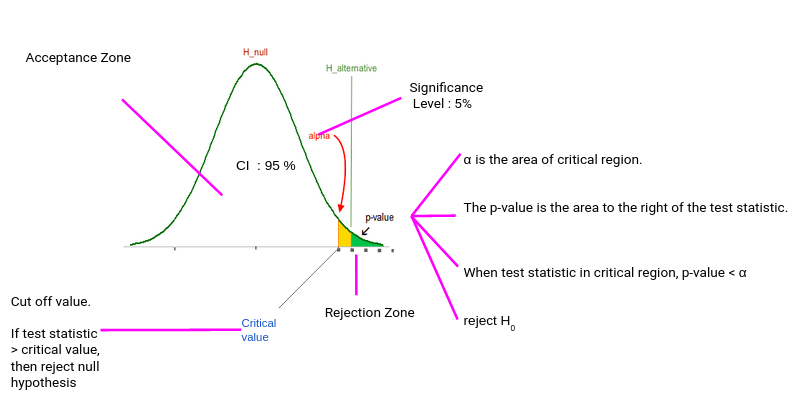
Typically, we set the Significance level at 10%, 5%, or 1%. If our test score lies in the Acceptance Zone we fail to reject the Null Hypothesis. If our test score lies in the critical zone, we reject the Null Hypothesis and accept the Alternate Hypothesis.
Critical Value is the cut off value between Acceptance Zone and Rejection Zone. We compare our test score to the critical value and if the test score is greater than the critical value, that means our test score lies in the Rejection Zone and we reject the Null Hypothesis. On the opposite side, if the test score is less than the Critical Value, that means the test score lies in the Acceptance Zone and we fail to reject the null Hypothesis.
But why do we need p-value when we can reject/accept hypotheses based on test scores and critical value?
p-value has the benefit that we only need one value to make a decision about the hypothesis. We don’t need to compute two different values like critical value and test scores. Another benefit of using p-value is that we can test at any desired level of significance by comparing this directly with the significance level.
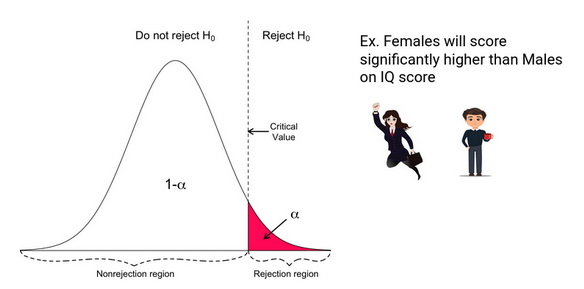
Directional Hypothesis
In the Directional Hypothesis, the null hypothesis is rejected if the test score is too large (for right-tailed and too small for left tailed). Thus, the rejection region for such a test consists of one part, which is right from the center.
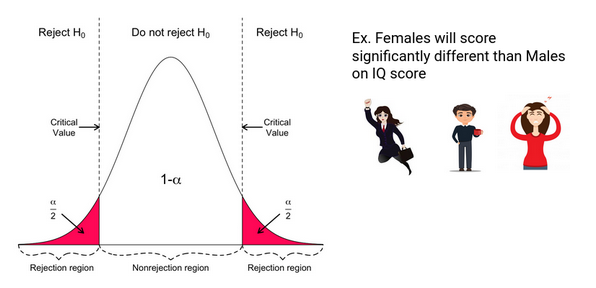
Non-Directional Hypothesis
In a Non-Directional Hypothesis test, the Null Hypothesis is rejected if the test score is either too small or too large. Thus, the rejection region for such a test consists of two parts: one on the left and one on the right.
What’s the z-Test?
Z-tests are a statistical way of testing a hypothesis when either:
- We know the population variance, or
- We do not know the population variance but our sample size is large n ≥ 30
If we have a sample size of less than 30 and do not know the population variance, then we must use a t-test.
One-Sample z-Test
We perform the One-Sample Z test when we want to compare a sample mean with the population mean.
Two-Sample Z Test
We perform a Two Sample Z test when we want to compare the mean of two samples.
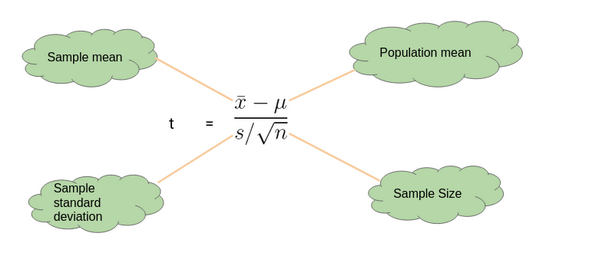
What is the t-Test?
t-Tests are a statistical way of testing a hypothesis when:
- We do not know the population variance
- Our sample size is small, n < 30
One-Sample t-Test
We perform a One-Sample t-test when we want to compare a sample mean with the population mean. The difference from the Z Test is that we do not have the information on Population Variance here. We use the sample standard deviation instead of population standard deviation in this case.
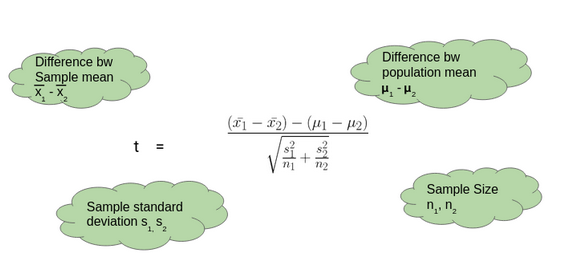
Two-Sample t-Test
We perform a Two-Sample t-test when we want to compare the mean of two samples.
Deciding between z-Test and t-Test
So when we should perform the Z test and when we should perform t-Test? It’s a key question we need to answer if we want to master statistics.
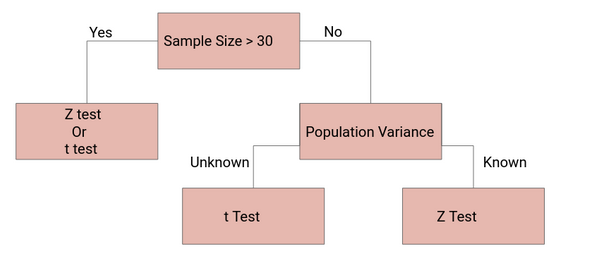
If the sample size is large enough, then the Z test and t-Test will conclude with the same results. For a large sample size, Sample Variance will be a better estimate of Population variance so even if population variance is unknown, we can use the Z test using sample variance.
Similarly, for a Large Sample, we have a high degree of freedom. And since t**-distribution approaches the normal distribution**, the difference between the z score and t score is negligible.